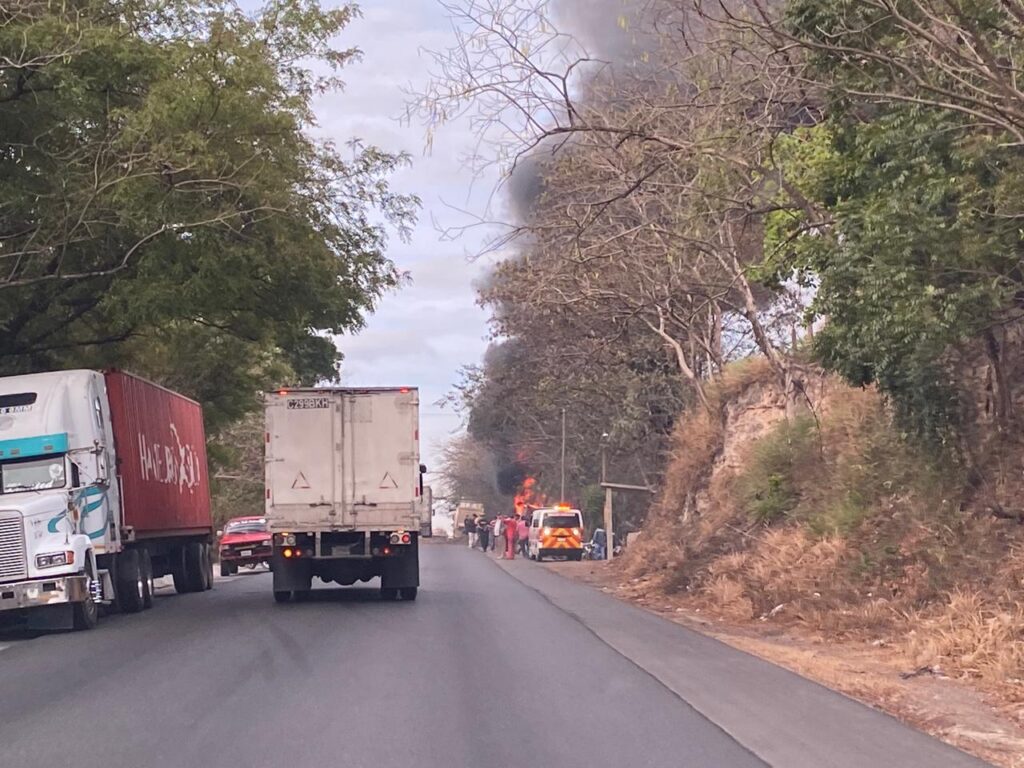

Mediante el diálogo entre los 200 pobladores y agentes de la Policía Nacional Civil, se impidió que fuera quemados vivos a padre e hijo como los presuntos autores de una matanza contra una familia por un problema de tierra, dio lugar que se desatara la violencia en el caserío Xalabe Sabob de Cobán Alta Verapaz, tras la liberación de los sospechosos, fueron traslados a un lugar seguro y posteriormente fueron consignados al juzgado respectivo.
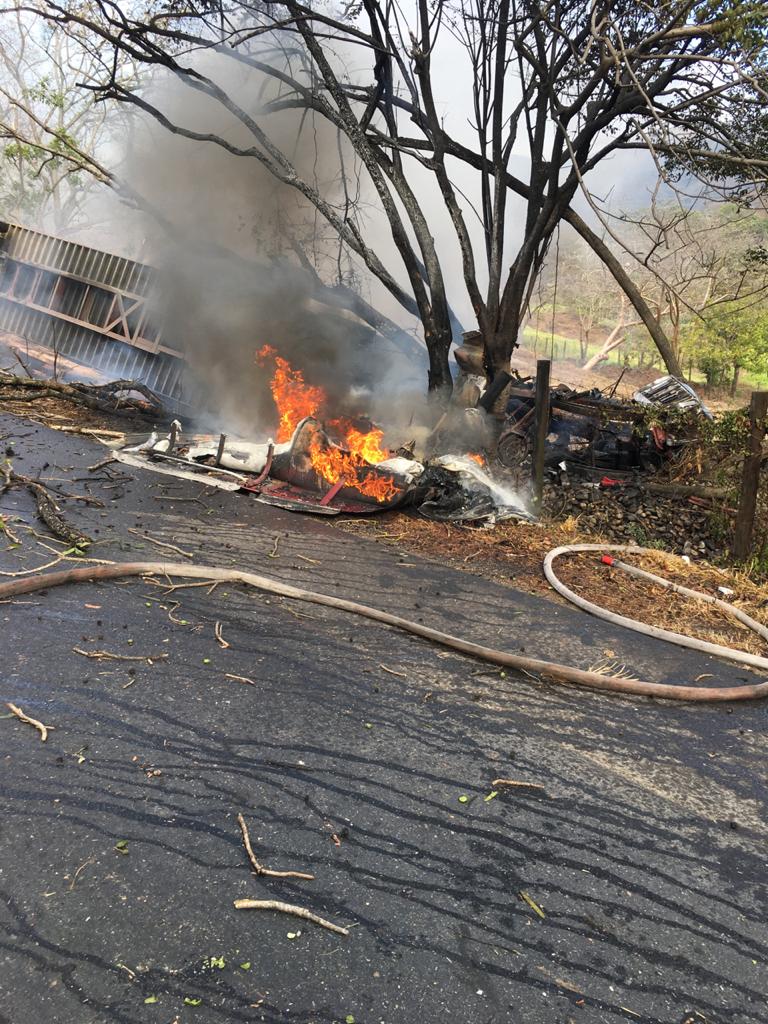
Se trata de Emilio Chub Tut, de 47 años y sus hijos Rolando Chub Cuz, de 21 años y un menor de 16, finalmente fueron rescatados por la PNC de una muerte segura, porque la turba enardecida estaba lista con combustible para convertirlos en antorchas humanas a la familia retenida.
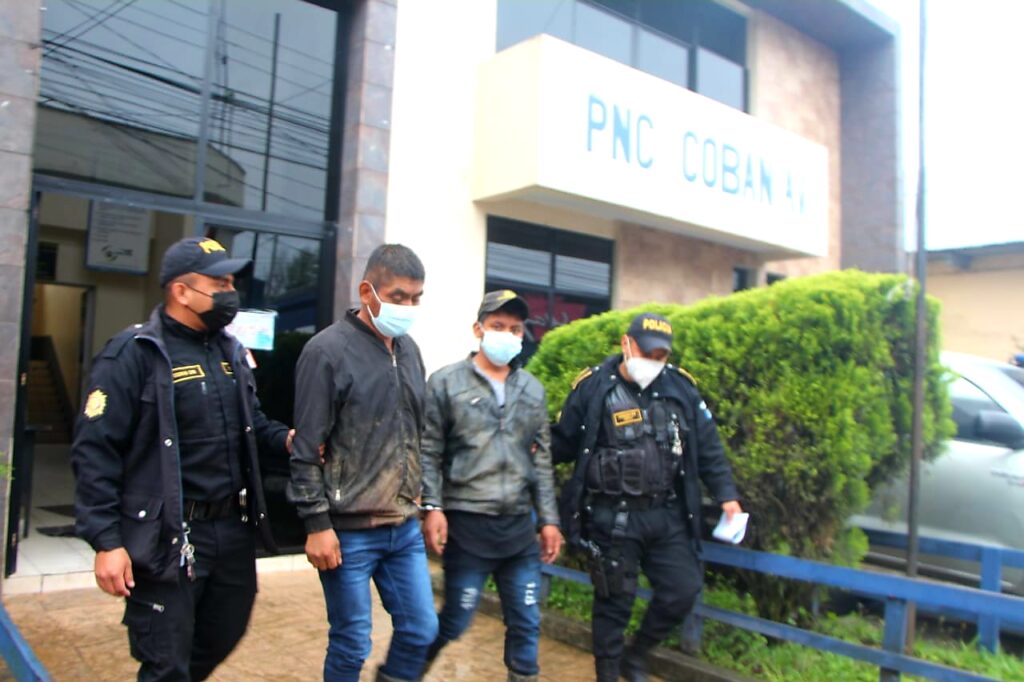
El dialogo realizado por el personal de la PNC permitió que vecinos del lugar entregaran a padre y sus hijos, son sindicados por los vecinos como presuntos responsables de la muerte de tres integrantes de una familia identificados como Arturo Ac Xi, de 60 años, y sus hijos Mauricio y Gustavo de apellidos Ac Macz
Al momento de su detención se les localizó una pistola calibre 9mm, con un cargador y municiones disponibles, un rifle calibre 22 sin más datos los vecinos impidieron que se continuará la diligencia, porque debieron de abandonar el área de conflicto.

La información señala que el domingo recién pasado, al domicilio de los capturados, ingresaron los fallecidos, quienes dieron muerte con arma de fuego a Rosario Chub Cuz, de 21 años, hija y hermana de los detenidos, quien falleció de inmediato. Este enfrentamiento entre familias, se derivó de un problema de tierras.
Las investigaciones siguen por parte de agentes investigadores de la PNC, mientras los capturados fueron puestos a disposición del juzgado correspondiente y el menor remitido a un juzgado de menores en conflicto con la ley penal